The Process Analyzer in the SAP GUI
Opening the Process Analyzer in the SAP GUI
Call transaction /WMD/XF_PA_ONL.
➣ The selection screen will open.
Enter search terms in the search fields as needed.
For information on search fields, see Process Analyzer: Search Fields in the SAP GUI.
Click the
 Execute button or press F8.
➤ The Process Analyzer will open.
Process Analyzer: Search Fields in the SAP GUI
Element | Search field | Description |
|---|---|---|
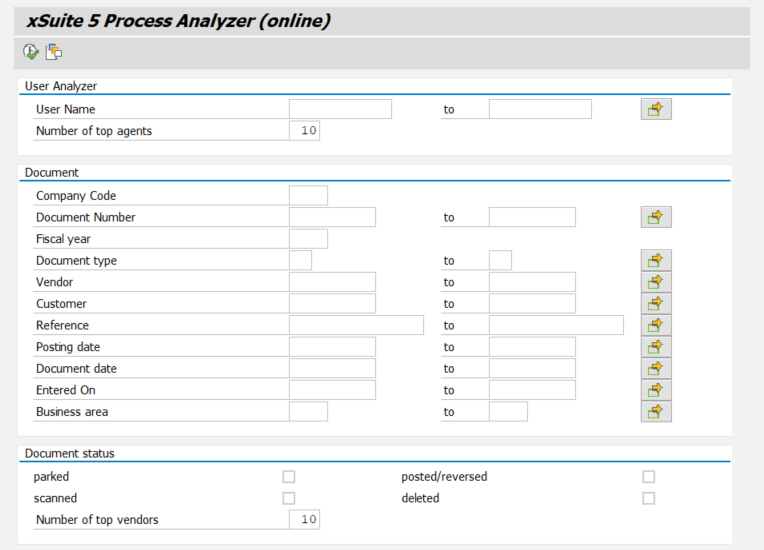
User Analyzer | User name | Searches for specific users. The search for users offers the possibility of comparing different agents that have processed documents or evaluating individual users. |
Number of top agents | Defines the number of top agents to be displayed. Maximum value: 999. | |
Document | Company Code | Restricts results to data from a specific company code. The specification of a company code is mandatory. |
Document Number | Restricts results to data from a single document or a specified range of documents based on the document number. | |
Fiscal Year | Restricts results to data from a specific fiscal year. The specification of a fiscal year is mandatory. | |
Document type | Restricts results to data of one or more document types, such as | |
Vendor | Restricts results to data from one or more suppliers. | |
Customer | Restricts results to data of one or more customers. | |
Reference | Restricts results to data from a single document or a defined range of documents by reference number. | |
Posting date | Restricts results to data for a specific posting period using the posting date. | |
Document date | Restricts results to data from a certain period of time using the document date. | |
Entered on | Restricts results to data from a certain period of time using the date of entry. | |
Business area | Restricts results to data from one or more business areas. | |
Document status | parked | Defines that data is displayed for parked documents. |
posted/reversed | Specifies that the data of posted and reversed documents is displayed. | |
scanned | Specifies that the data of scanned documents is displayed. | |
deleted | Specifies that the data of deleted documents is displayed. | |
Number of top vendors | Defines the number of top vendors to be displayed. Maximum value: | |
Display processing times | Total processing time | Determines whether the total processing time is displayed. |
Calc. with factory calendar | Determines whether the total processing time is calculated taking into account a selected factory calendar. | |
Option | Contra entries | Determines whether the entries in the Option area are taken into account for the display of the data. |
Cost center | Restricts results to data of one or more cost centers. | |
G/L account | Restricts results to data from one or more G/L accounts. | |
Profit center | Restricts results to data from one or more profit centers. | |
Order | Restricts results to data from one or more internal orders. | |
WBS element | Restricts results to data from one or more WBS elements. | |
Network | Restricts results to data from one or more networks. | |
Screen adjustments | Width of numbers+duration window [%] | Defines the width of the Number and Ø Runtime range as a percentage. The total width is made up of the widths of the areas number and Ø processing times, processing status of documents and top suppliers. |
Width of processing state window [%] | Defines the width of the Processing state of documents area as a percentage. The total width is made up of the widths of the areas number and Ø processing times, processing status of documents and top suppliers. | |
Width of Top10 window [%] | Defines the width of the Top Suppliers area as a percentage. The total width is made up of the widths of the areas number and Ø processing times, processing status of documents and top suppliers. | |
Height of amount window [%] | Defines the amount of the Total Invoices area in percentages. The height of this window has a corresponding effect on the height of the other windows. |
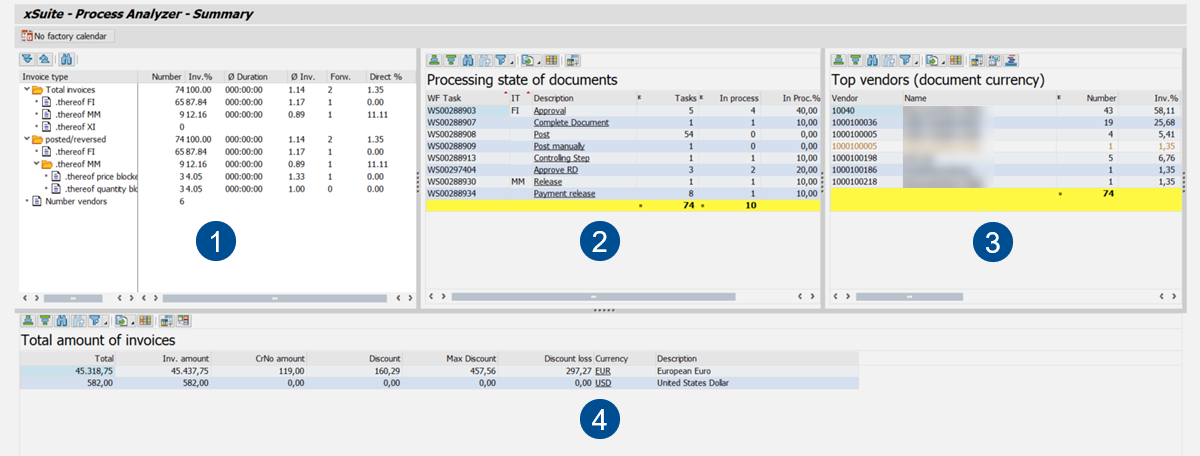
Process Analyzer: Main Overview in the SAP GUI
Element | Description | |
|---|---|---|
1 | Number and Ø duration | Shows the total of all invoices for the selected period and the average processing times of these invoices, broken down by invoice type. For more information, see Pane "Number and Ø Processing Times". |
2 | Processing state of documents | Displays an overview of the processing status of documents in a selected period, broken down by workflow task. For more information, see Pane "Processing State of Documents". |
3 | Top vendors / Top agents | Depending on the search parameters entered, shows the top suppliers or the top agents and their share of the invoices in the selected period. For more information, see Pane "Top Suppliers" and Pane "Top Agents". |
4 | Total amount of invoices | Shows the total amount of all invoices in the selected period. For more information, see Pane "Total Amount of Invoices". |
Pane "Number and Ø Processing Times"
This area shows an overview of all processed invoices in the selected period and the respective processing times.
The overview is divided into invoice categories (e.g. FI) and document status (e.g. posted/cancelled). Which invoice types and document statuses appear depends on the entries in the search fields of the selection screen. For more information, see Process Analyzer: Search Fields in the SAP GUI.
Column | Description |
|---|---|
Invoice type | Shows the categories of the data calculation. This includes the invoice categories and the document statuses. To open a detailed list view of the invoices of this category, double-click on one of the categories. |
Number | Shows the total number of invoices for each invoice type. For a detailed overview of the average processing time per workflow step for these invoices, double-click a value in the Number column. |
Inv.% | Shows the percentage share of each invoice type in the total number of invoices. |
Ø Duration | Shows the average processing time of documents of the respective invoice type. The average processing time takes into account the total processing time of xSuite Interface up to document posting. Times in which no agents were involved are also included. The value has the structure Note: To display the average processing time, the Total processing time checkbox must be selected in the Process Analyzer selection screen. |
Ø Inv. | Shows the average number of persons involved per invoice. All dialog steps are included in the calculation. Each person involved is only taken into account a single time. Technical background users (e.g. XFLOWBTC) are not included. |
Forw. | Shows the number of forwarded invoices of each invoice type. |
Direct % | Displays the percentage of invoices of the respective invoice category that were automatically posted in the background. |
Pane "Processing State of Documents"
This area displays an overview of the processing status of the invoice documents in the selected period.
Column | Description |
|---|---|
WF Task | Shows the technical name of the workflow task. |
IT | Shows the invoice type. |
Description | Shows the name of the workflow task. To open a detailed overview of the documents that are in this workflow task, click on the name of the workflow task. |
Tasks | Shows the number of documents that are in the respective workflow task. |
In process | Shows the number of documents that are in the respective workflow task and have the status "In process." |
In Proc.% | Shows the percentage of all processes in progress. |
Pane "Top Agents"
This area shows an overview of the agents who have processed the largest number of invoices in the selected period.
To display the Top Agents area, enter one or more users in the User Name search field of the selection view. The number of editors displayed depends on your entry in the Number of top editors field in the selection view. For more information, see Process Analyzer: Search Fields in the SAP GUI.
Notice
The display of the Top agents area can be activated or deactivated by the administrator.
Column | Description |
|---|---|
Agent | Shows the user name. |
Full name | Shows the full name of the user. |
Number | Shows the total number of invoices processed by each user. |
Inv.% | Shows the percentage of processed invoices as a percentage of the total of all invoices of the selected period. |
Ø Duration | Shows the average processing time required by the respective user per invoice. The value has the structure |
Total | Shows the total amount of all invoices processed by the respective agent. The total amount results from the invoice total, minus the credit note amount. |
Inv. amount | Shows the total invoice amount for the respective agent, without consideration of credit notes. |
CrNo amount | Shows the total credit memo amount for the respective agent. |
Currency | Shows the currency. To toggle between local currency and document currency, click the button |

Pane "Top Suppliers"
This area shows an overview of the suppliers with the largest number of invoices in the selected period.
The number of suppliers displayed depends on your entry in the Number of top suppliers field in the selection view. For more information, see Process Analyzer: Search Fields in the SAP GUI.
Column | Description |
|---|---|
Vendor | Shows the number of the supplier. |
Name | Shows the name of the supplier. Click on the name of the supplier to open a list of all invoices of this supplier in the selected period. |
Number | Shows the number of invoices of the respective supplier. |
Inv.% | Shows the percentage of invoices from each supplier as a percentage of the total number of invoices. |
Ø Duration | Shows the average lead time for documents from the respective vendor. The average lead time is calculated as the sum of the lead times of all documents of the vendor divided by the total number of documents of the vendor. Deleted documents are not included. The value has the structure |
Ø Inv. | Shows the average number of persons involved per invoice from the respective supplier. All dialog steps are included in the calculation. Each person involved is only taken into account a single time. Technical background users (e.g. XFLOWBTC) are not included. |
Forw. | Shows the number of forwarded invoices. |
Total | Shows the total amount of all invoices of the respective supplier. The total amount results from the invoice total, minus the credit note amount. |
Inv. amount | Shows the total invoice amount for the respective agent, without consideration of credit notes. |
CrNo amount | Shows the total of all credit memos for the respective vendor. |
Currency | Shows the currency. To toggle between local currency and document currency, click the button |
Pane "Total Amount of Invoices"
This area shows a summary of all invoice amounts in the selected period.
Column | Description |
|---|---|
Total | Shows the total amount of all invoices of the selected period, minus the credit memo amount. |
Inv. amount | Shows the total amount of all invoices of the selected period. |
CrNo amount | Shows the total of all credit memos for the selected period. |
Discount | Displays the total of all target cash discount amounts. The cash discount amount is calculated from the terms of payment of the invoices and may differ from the actual cash discount amount. |
Max Discount | Shows the possible cash discount amount. The possible cash discount amount is calculated from the target cash discount amount minus the actual cash discount amount. |
Discount loss | Shows the total of all losses in target cash discounts in the selected period. |
Currency | Shows the currency abbreviation, e.g. |
Description | Shows the long name of the currency, e.g. |
Process Analyzer: Buttons in the SAP GUI
Button | Name | Description |
|---|---|---|
| Sort in Ascending Order | Opens sorting options for the hit list. When you select a column in the sort options, the Sort in Ascending Order radio button will be enabled. |
| Sort in Descending | Opens sorting options for the hit list. When you select a column in the sort options, the Sort in Descending Order radio button will be enabled. |
| Find | Opens search options for the hit list. |
| Find next | Moves to the next hit in the hit list. |
| Set Filter... | Opens the filter options for the hit list. |
| Export | Exports the hit list. The following export formats are available: Spreadsheet, Local file and HTML download. |
| Change Layout... | Opens settings for column selection, sorting, filtering and display of the hit list. |
| Show as list | Opens the documents specified in the selected row in a detailed list. |
| Switch local/document currency | Switches between the display of local currency and the display of document currency. |
| Show top price/quant. blocked | Opens an overview of the number of price- and quantity-blocked invoices from top suppliers. |
| Vendors view on/off | Enables or disables the supplier view. If the vendor view is activated, the total amount of all invoices will be broken down into the total amounts of the top vendors. |


